This post, leveraging AI, summarizes and analyzes the key aspects of the research paper “Multifractal Properties of the Ukraine Stock Market”. For in-depth information, please refer to the original PDF.
📄 Original PDF: Download / View Fullscreen
English Summary
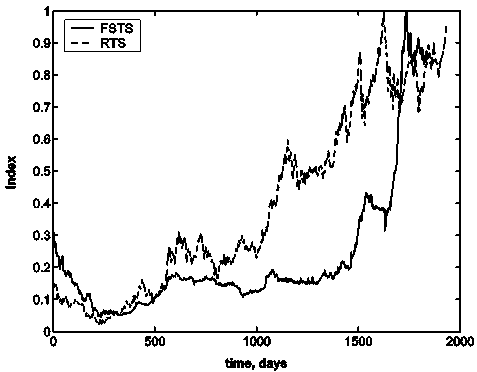
The provided paper focuses on analyzing the multifractal properties of stock market data from Ukraine and Russia using methods such as wavelet transform modulus maxima (WTMM) and detrended fluctuation analysis (MF-DFA). The researchers assume that scale-independent measures depend solely on underlying mechanisms controlling the system. They explore the scaling exponents τ(q), qth order fluctuations Fq(n), singularity strength α, and singularity spectrum f(α) to characterize multifractality in stock market data. Consistently with log-log plots, Russia Trade System (RTS) exhibits higher nonlinearity and stronger multifractal nature compared to Ukraine’s First Stock Trade System index (FSTS), which displays weaker multifractal characteristics.
Key Technical Terms
Below are key technical terms and their explanations to help understand the core concepts of this paper. You can explore related external resources via the links next to each term.
- Multifractal de-trended fluctuation analysis method (MF-DFA) [Wikipedia (Ko)] [Wikipedia (En)] [나무위키] [Google Scholar] [Nature] [ScienceDirect] [PubMed]
Explanation: Method used for detecting scaling behavior of signals in stock market data, generalizing Hurst exponent H. It calculates signal profiles by least squares fitting polynomials to transaction moments and analyzes fluctuations Fq(n) for various qth order functions. - Wavelet transform modulus maxima (WTMM) [Wikipedia (Ko)] [Wikipedia (En)] [나무위키] [Google Scholar] [Nature] [ScienceDirect] [PubMed]
Explanation: Technique used to extract scaling exponents from wavelet amplitudes over all scales in stock market data analysis, focusing on fractal structure of temporal organization of singularities in signals. It involves continuous wavelet transforms and partitioning function estimation Zq(a). - Singularity spectrum [Wikipedia (Ko)] [Wikipedia (En)] [나무위키] [Google Scholar] [Nature] [ScienceDirect] [PubMed]
Explanation: A method for characterizing multifractality in stock market data by observing the slope of log-log plots Fq vs n, where qth order fluctuations reveal power law scaling behavior Fq(n) ∝nτ(q). It helps determine monofractal and multifractal signals distinction. - Hurst exponent H [Wikipedia (Ko)] [Wikipedia (En)] [나무위키] [Google Scholar] [Nature] [ScienceDirect] [PubMed]
Explanation: Equivalent to τ(q), used in analyzing signal profiles by least squares fitting polynomials Pν(l) of order l, indicating scaling exponents for stock market data analysis. - Singularity strength α [Wikipedia (Ko)] [Wikipedia (En)] [나무위키] [Google Scholar] [Nature] [ScienceDirect] [PubMed]
Explanation: Parameter calculated from singularity spectrum f(α), representing the variety of scaling behavior in stock market signals, generalizing Hurst exponent H with equivalence H =τ(q).
View Original Excerpt (English)
Multifractal Properties of the Ukraine Stock Market A.Ganchuk, V.Derbentsev, V. Soloviev2006 Economical Cybernetics Department, Kryviy Rih Economic Institute Kyiv National Economic University by Vadim Getman, Kryviy Rih, UkraineAug fax, phone: +380 564 901512 v n soloviev@kneu.dp.ua1 Abstract Recently the statistical characterizations of financial markets based on physics concepts and methods attract considerable attentions. We used two possible procedures of analyzing multifractal properties of a time series. The first one uses the continuous wavelet transform and extracts scaling exponents from the wavelet transform amplitudes over all scales. The second method is the multifractal version of the detrended fluctuation analysis method (MF- DFA). The multifractality of a time series we analysed by means of the difference of values singularity stregth αmax and αmin as a suitable way to[physics.data-an] characterise multifractality. Singularity spectrum calculated from daily re- turns using a sliding 1000 day time window in discrete steps of 1. . . 10 days. We discovered that changes in the multifractal spectrum display distinctive pattern around significant “drawdowns”. Finally, we discuss applications to the construction of crushes precursors at the financial markets. Key words: Multifractal, stock market, singularity spectrum PACS: 89.20.-a, 89.65.Gh, 89.75.-k 1. Introduction Multivariate time series are detected and recorded both in experiments and in the monitoring of a wide number physical, biological and economic systems. A first instrument in the investigation of multivariate time series is the correlation matrix. The study of the properties of the correlation matrix has a direct relevance in the investigation of mesoscopic physical systems,arXiv:physics/0608009v1 high energy physics, investigation of microarray data in biological systems and econophysics [1]. Quantifying correlations between different stocks is a topic of interest not only for scientific reasons of understanding the economy as a complex dynamical system, but also for practical reasons such as asset allocation and portfolio risk estimation [2–5]….
🇰🇷 한국어 보기 (View in Korean)
한글 요약 (Korean Summary)
제공된 논문은 WTMM (Wavelet Transform Modulus Maxima) 및 DEFRENDERNED 변동 분석 (MF-DFA)과 같은 방법을 사용하여 우크라이나 및 러시아의 주식 시장 데이터의 다중 공적 특성을 분석하는 데 중점을 둡니다. 연구자들은 척도 독립적 측정이 시스템을 제어하는 기본 메커니즘에만 의존한다고 가정합니다. 그들은 스케일링 지수 τ (Q), Qth 차수 변동 FQ (N), 특이점 강도 α 및 특이점 스펙트럼 F (α)를 탐색하여 주식 시장 데이터의 다중 공정 성을 특성화합니다. 로그 로그 플롯과 일관되게 러시아 무역 시스템 (RTS)은 우크라이나 최초의 주식 무역 시스템 지수 (FSTS)와 비교하여 더 높은 비선형 성과 더 강한 다중 락트 특성을 나타냅니다.
주요 기술 용어 (한글 설명)
- Multifractal de-trended fluctuation analysis method (MF-DFA)
설명 (Korean): 주식 시장 데이터에서 신호의 스케일링 동작을 감지하는 데 사용되는 방법, Hurst Exponent H를 일반화합니다. 트랜잭션 모멘트에 다항식을 맞추고 다양한 QTH 주문 기능에 대한 변동 FQ (n)를 분석하여 신호 프로파일을 계산합니다.
(Original English: Method used for detecting scaling behavior of signals in stock market data, generalizing Hurst exponent H. It calculates signal profiles by least squares fitting polynomials to transaction moments and analyzes fluctuations Fq(n) for various qth order functions.) - Wavelet transform modulus maxima (WTMM)
설명 (Korean): 주식 시장 데이터 분석에서 모든 척도에서 웨이블릿 진폭에서 스케일링 지수를 추출하는 데 사용되는 기술. 연속 웨이블릿 변환 및 분할 함수 추정 ZQ (A)가 포함됩니다.
(Original English: Technique used to extract scaling exponents from wavelet amplitudes over all scales in stock market data analysis, focusing on fractal structure of temporal organization of singularities in signals. It involves continuous wavelet transforms and partitioning function estimation Zq(a).) - Singularity spectrum
설명 (Korean): 로그 로그 플롯 FQ 대 N의 기울기를 관찰함으로써 주식 시장 데이터의 다중 공학 성을 특성화하는 방법은 QTH 순서 변동이 전력 법률 스케일링 동작 FQ (N) ∝Nτ (Q)를 나타냅니다. 그것은 모노 프랙탈 및 다중 락탈 신호의 차이를 결정하는 데 도움이됩니다.
(Original English: A method for characterizing multifractality in stock market data by observing the slope of log-log plots Fq vs n, where qth order fluctuations reveal power law scaling behavior Fq(n) ∝nτ(q). It helps determine monofractal and multifractal signals distinction.) - Hurst exponent H
설명 (Korean): τ (q)와 동일하며, 정수 L의 최소 제곱에 의해 신호 프로파일을 분석하는 데 사용되는 τ (q)와 동일합니다.
(Original English: Equivalent to τ(q), used in analyzing signal profiles by least squares fitting polynomials Pν(l) of order l, indicating scaling exponents for stock market data analysis.) - Singularity strength α
설명 (Korean): 단수성 스펙트럼 F (α)로부터 계산 된 파라미터는 주식 시장 신호에서 다양한 스케일링 동작을 나타내며, 동등성 H = τ (Q)와 Hurst 지수 H를 일반화합니다.
(Original English: Parameter calculated from singularity spectrum f(α), representing the variety of scaling behavior in stock market signals, generalizing Hurst exponent H with equivalence H =τ(q).)
발췌문 한글 번역 (Korean Translation of Excerpt)
우크라이나 주식 시장 A.Ganchuk, V.Derbentsev, V. Soloviev2006 경제 사이버네틱 부서, Kryviy RIH Economic Institute Kyiv National University의 Vadim Getman, Kryviy Rih, Kryviy Rih, Ukraineaug 팩스, 전화 : +380 564 901512 v n noviev the the the the the the the the the the the the the the the the the the soloviev. 물리학 개념과 방법에 기초한 재무 시장의 통계적 특성은 상당한 관심을 끌고있다. 우리는 시계열의 다단계 특성을 분석하는 두 가지 가능한 절차를 사용했습니다. 첫 번째는 연속 웨이블릿 변환을 사용하고 모든 스케일에 대한 웨이블릿 변환 진폭의 스케일링 지수를 추출합니다. 두 번째 방법은 감소 된 플루 큐어링 분석 방법 (MF-DFA)의 다중 팩트 버전입니다. [Physics.data-an]가 다중 유적 성을 특성화하는 데 적합한 방법으로서 특이점 Stregth αmax 및 αMin의 차이를 통해 분석 한 시계열의 다중 공정 성. 특이점 스펙트럼은 매일 1의 개별 단계에서 슬라이딩 1000 일 시간 창을 사용하여 일일 회전합니다. . 10 일. 우리는 다제 스펙트럼의 변화가 상당한 “드로 다운”주위에 독특한 패턴을 나타낸다는 것을 발견했습니다. 마지막으로, 우리는 금융 시장에서 Crushes Precursors의 건설에 대한 응용에 대해 논의합니다. 핵심 단어 :다면, 주식 시장, 특이점 스펙트럼 PACS : 89.20.-A, 89.65.GH, 89.75.-K 1. 소개 다변량 시계열은 실험과 물리적, 생물학적 및 경제 시스템의 모니터링에서 검출되고 기록됩니다. 다변량 시계열의 조사에서 첫 번째기구는 상관 관계 행렬입니다. 상관 관계 매트릭스의 특성에 대한 연구는 Mesoscopic Physical Systems, Arxiv : Physics/0608009V1 고 에너지 물리학, 생물학적 시스템 및 생태 물리학에서의 마이크로 어레이 데이터의 조사와 직접적인 관련성을 가지고 있습니다 [1]. 다른 주식 간의 상관 관계를 정량화하는 것은 경제를 복잡한 역학 시스템으로 이해하는 과학적 이유뿐만 아니라 자산 할당 및 포트폴리오 위험 추정과 같은 실제적인 이유 [2–5]에 대한 관심 주제입니다.
Source: arXiv.org (or the original source of the paper)
답글 남기기